2023 data available NOW!
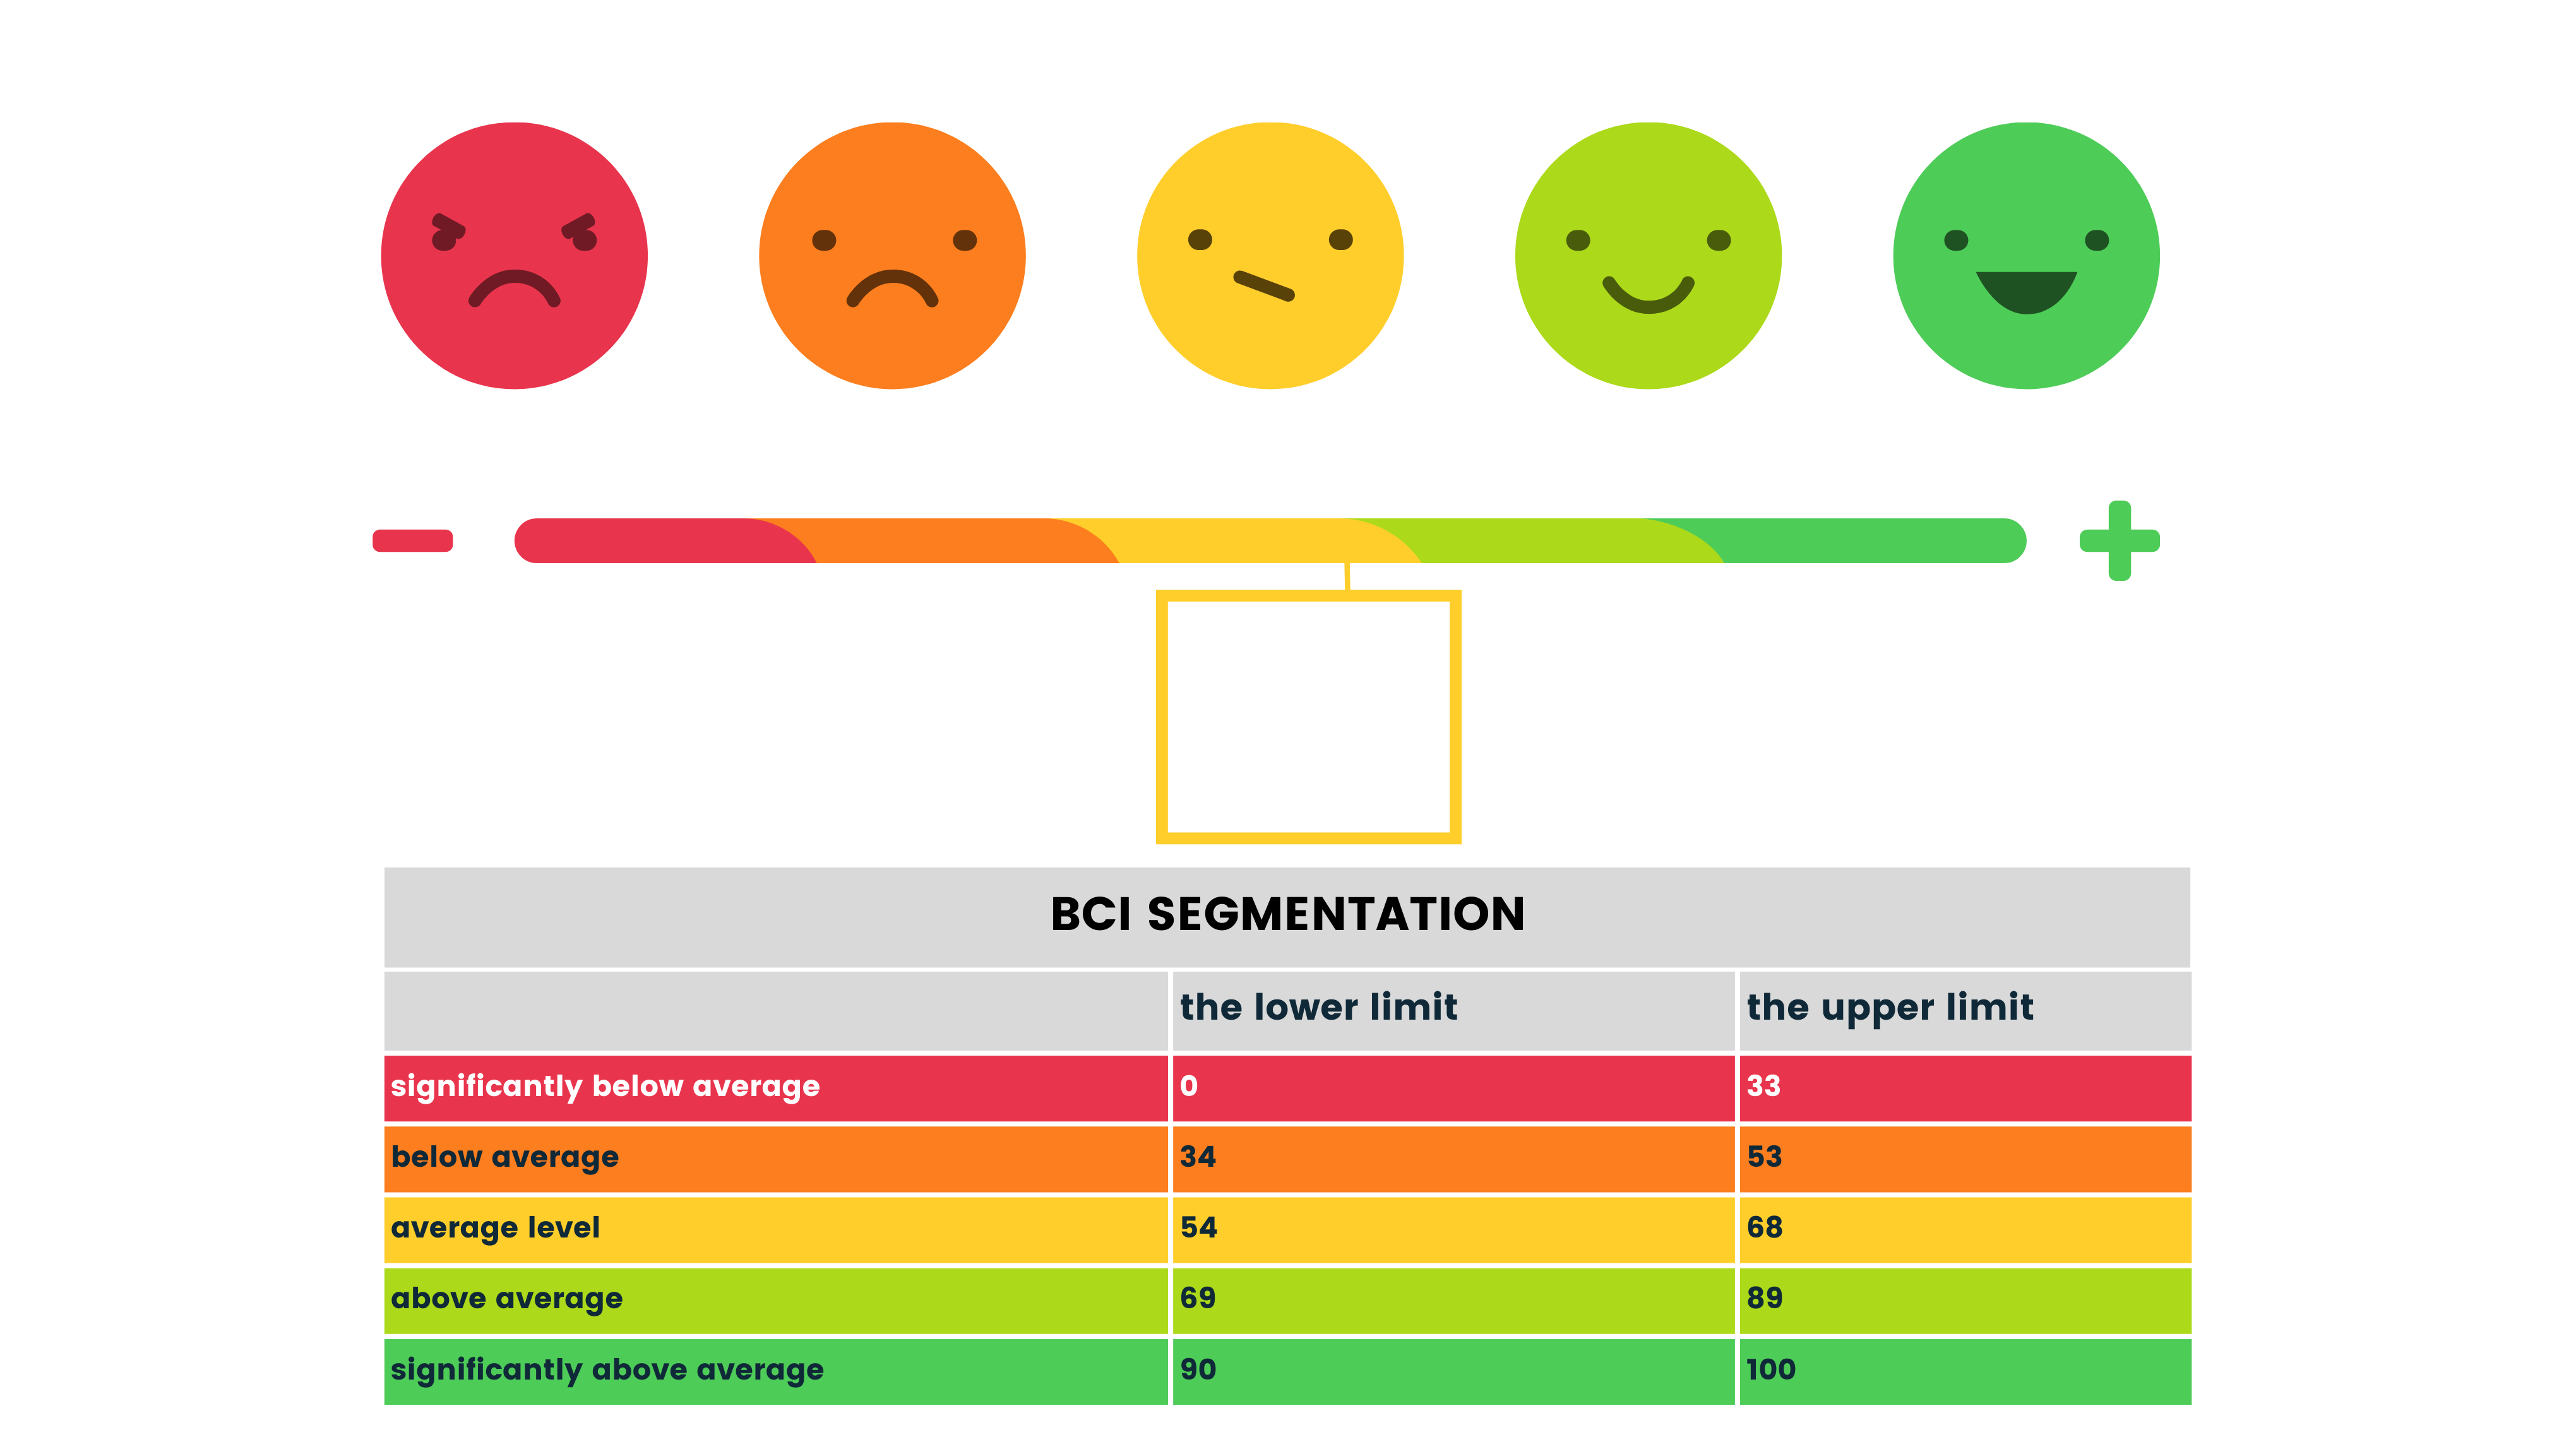
The number of 2023 is 65! That is the average value of the Brand Comparison Index across the industries surveyed! Within each industry, the average value ranges from 43 to 77.
Brand Comparison Index
B2C customer research, evaluating more than 280 brands from 21 sectors on the Czech market. The Brand Comparison Index gives the opportunity to compare the customer success of brands with each other on a scale of 0 to 100.
What is the Brand Comparison Index made of?
SATISFACTION - "How satisfied are you as a customer with the approach and offer of the brand?"
RECOMMENDATION - "How likely are you to recommend the brand to your friends, colleagues or family?"
BEST BRAND IN THE INDUSTRY - "What is your favourite brand (within the industry)? Regardless of whether or not you are a client.

What do you get in the Brand Comparison Index?
VITALITY - Each brand has a measured within the index: Familiarity/awareness, customer experience, preference/liking, satisfaction.
NET PROMOTER SCORE - Classic NPS + information about promoters and detractors.
BENCHMARK - You can compare your customer research results with the Brand Comaprison Index. You also have the option of comparing to another industry or just selecting certain brands.
MONITORING - Research is done every year so we sto track trends. Industries and brands are updated continuously.

SC&C CEO Jana Hamanová about BC Indexu
The year 2023 is already the fifth year of the BC Index, and it deserves a short review. 2019 was the last "normal" year we experienced without realizing it at the time. It was very fortunate for the Index itself, because we have a benchmark for the period that followed, which was far from normal - the first and second years of the covid, and then 2022, when the war in Ukraine began and shifted our perception back to another dimension. 2023 is the second year of the war and the second year after the pandemic, customers have been living in a context of high inflation, fears of economic recession, increased cost of living in the last 12 months and all of that has to some extent seeped into their perception of the brand experience as well. On top of that, new technological challenges are emerging around us - AI, robotics, digitalisation. This may be the last introduction to a BC Index report by a living person, and it may be the last BC Index report written by a living person. We'll see at the sixth annual 
IN THE BC INDEX YOU CAN BROWSE MORE THAN 280 BRANDS ACROSS 21 INDUSTRIES!
Why BRAND COMPARISON INDEX?
-
Simple and easy to understand customer success rates for your brand and competitors
-
A good basis for your segmentation
-
Fresh numbers every year
-
Ability to get information on other industries as well and compare it with your own thanks to the same methodology
-
You can design your own "industry" in which we include the brands you are interested in
Still not convinced? 🙂 Then we can talk about it, just write or call us.
Contact Form
Billing Information
SC&C Ltd
Krakovská 7 , 110 00 Prague 1
VAT: CZ45280541
IBAN: CZ83 0100 0000 4388 0265 0247
BIC (SWIFT): KOMBCZPP
Contact:
Filip Oliva
Tel.: +420 739 690 490
Email: foliva@bcindex.cz